Denver Colorado - Harvard Gultch Interceptor
Denver, CO - November, 2011
SUMMARY
Pipe penetrating radar (PPR), a new pipe inspection technology was used for condition assessment in a 27 inch interceptor in Denver, CO. Metro Wastewater Reclamation District (MWRD), the owner of the interceptor had limited information about the condition of the pipe, so they contacted SewerVUE in order to undertake a multisensory pipe condition assessment that included CCTV, PPR and laser profiling.
PPR results showed pipe wall thickness in the 2.5-3.3” range that matched the core sample obtained by MWRD. Locations where rebar cover was less than the minimum ASTM standard were identified, however, deficient rebar cover appeared to be due to the pipe manufacturing process and not to corrosion. No significant voids were detected along the inspected line. Laser profiling identified corrosion along the flow line.
BACKGROUND
The Harvard Gultch interceptor, originally constructed in the 1950's was replaced with reinforcement concrete pipe (RCP) in the late 1970's. In 1983 the ownership was transferred to MWRD and only limited information is available about the condition of the pipe.
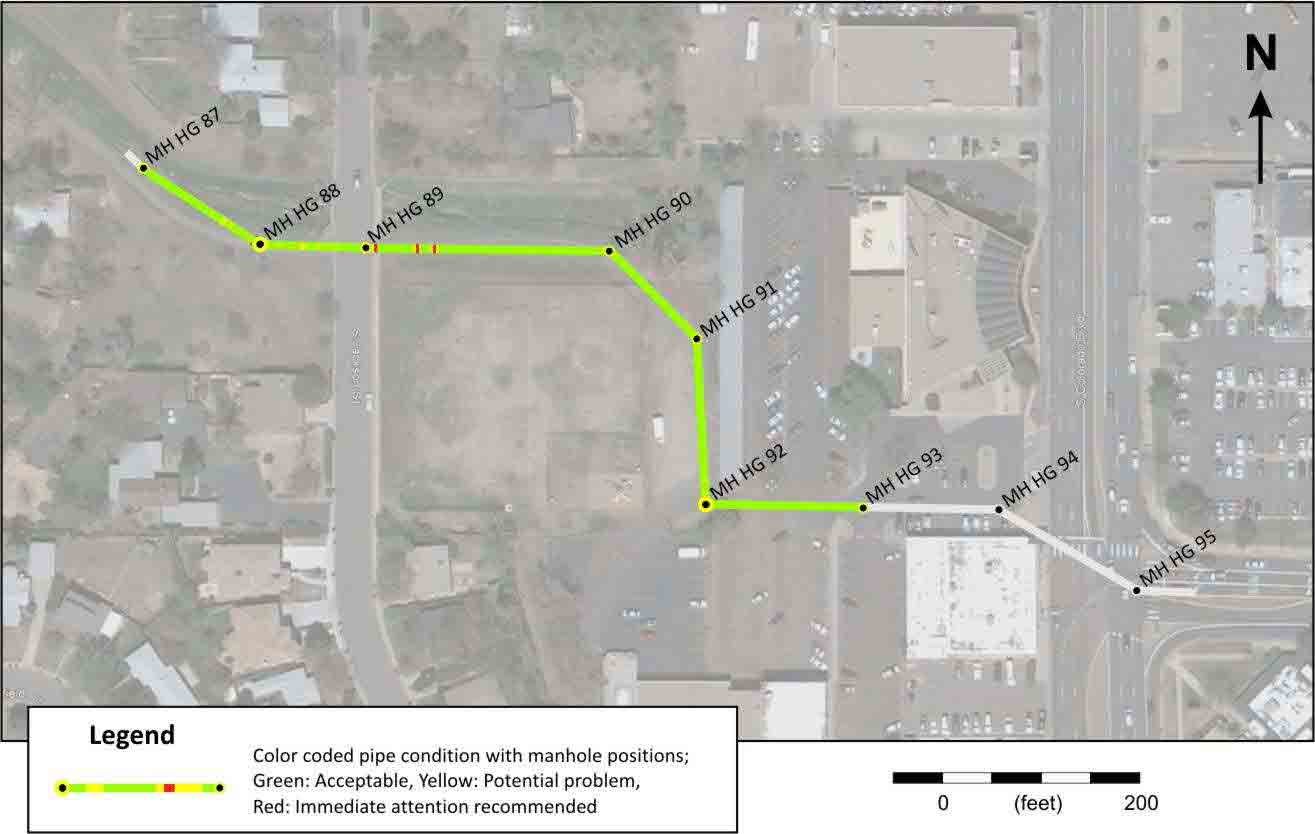
Figure 1. Aerial photo showing the location of the Harvard Gultch Interceptor that was inspected.
Pipe Penetrating Radar
Pipe penetrating radar (PPR) is the underground in-pipe application of ground penetrating radar (GPR). As the radar pulse travels through a pipe some of the energy will be reflected and refracted by any sharp change in material properties. These reflected waves are detected and recorded by a receiving antenna. The output is then processed and analyzed by a software that visualizes pipe wall thickness, rebar cover, voids outside the pipe as well as cracks or bedding symptoms.
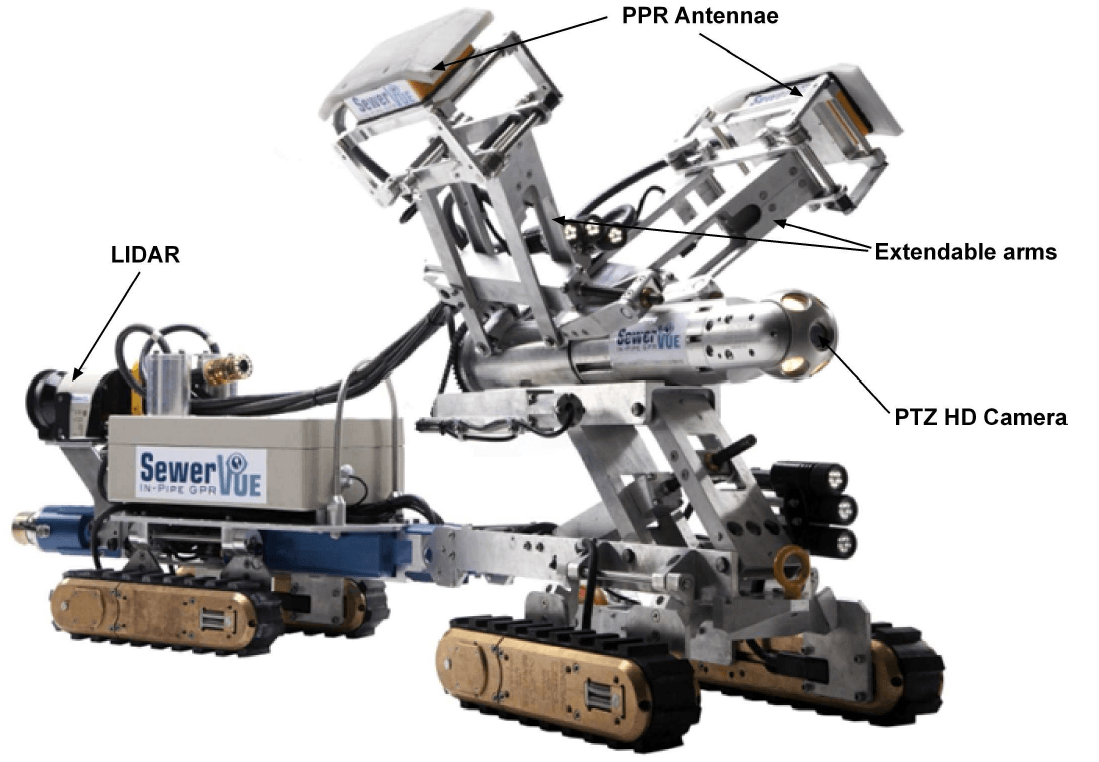
Figure 2. The SewerVUE Surveyor, a fourth generation multi-sensor inspection robot equipped with pan, tilt, zoom CCTV, LIDAR, and PPR.
The SewerVUE Surveyor that was used in Denver is the first commercially available multi-sensor inspection (MSI) robot that uses visual and quantitative technologies (CCTV, LIDAR, and PPR) to inspect underground pipes. The robot can be adjusted between 21 and 36-inch diameter pipes, the PPR antennae can be rotated between the nine and three o’clock positions. The CCTV and LIDAR data are recorded continuously and simultaneously.
RESULTS
A 880ft long segment of the 27 inch RCP was inspected in two deployments while the pipe remained in service. The inspection data were processed using Pipe Penetrating Radar Data Interpretation Application (PP-RADIAN), SewerVUE’s proprietary radar processing software. The interpreted PPR data showed the pipe wall thickness, rebar cover and grouted sections of the pipe. The pipe wall thickness from the PPR survey matched closely (98%) the core sample obtained earlier by MWRD personnel.
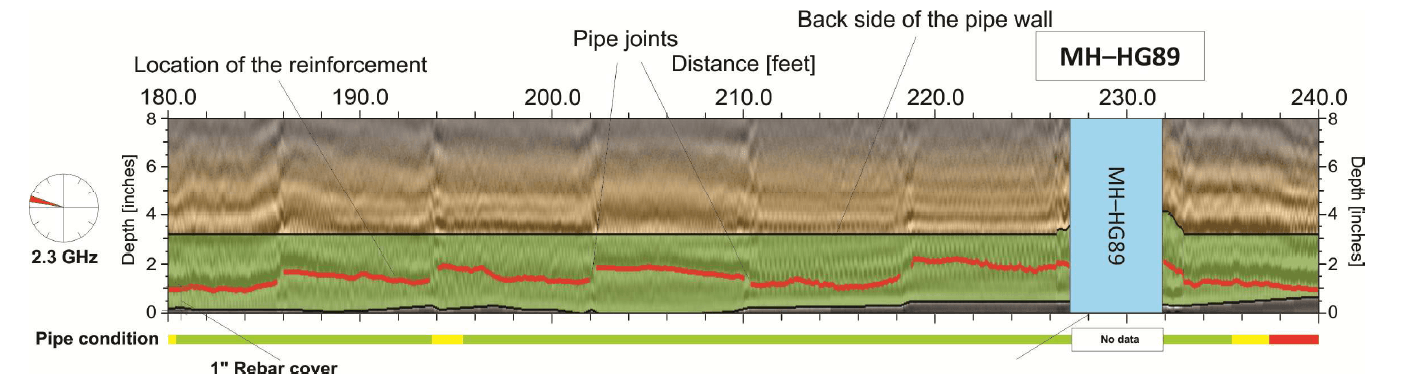
Figure 3. A typical PPR profile. The clock position and the frequency of the antenna are shown on the left side of the profile. The red color on the pipe condition marker indicates an area where immediate attention is recommended.
PPR data showed variations in pipe wall thickness, as well as location, depth and spacing of rebar. Pipe wall thickness appeared to be uniform with no significant pipe wall loss. The remaining pipe-wall thickness was between 2.5 - 3.3“. The measured minimum pipe wall thickness was 2.5”. Rebar cover, while showing variations along the surveyed clock positions appeared to be in the 0.25” and 3.2” range. Where rebar cover appeared to be less than 0.73” it was mostly due to the pipe manufacturing process and not the result of pipe wall loss. No significant voids were detected along the inspected line.
PPR RESULTS
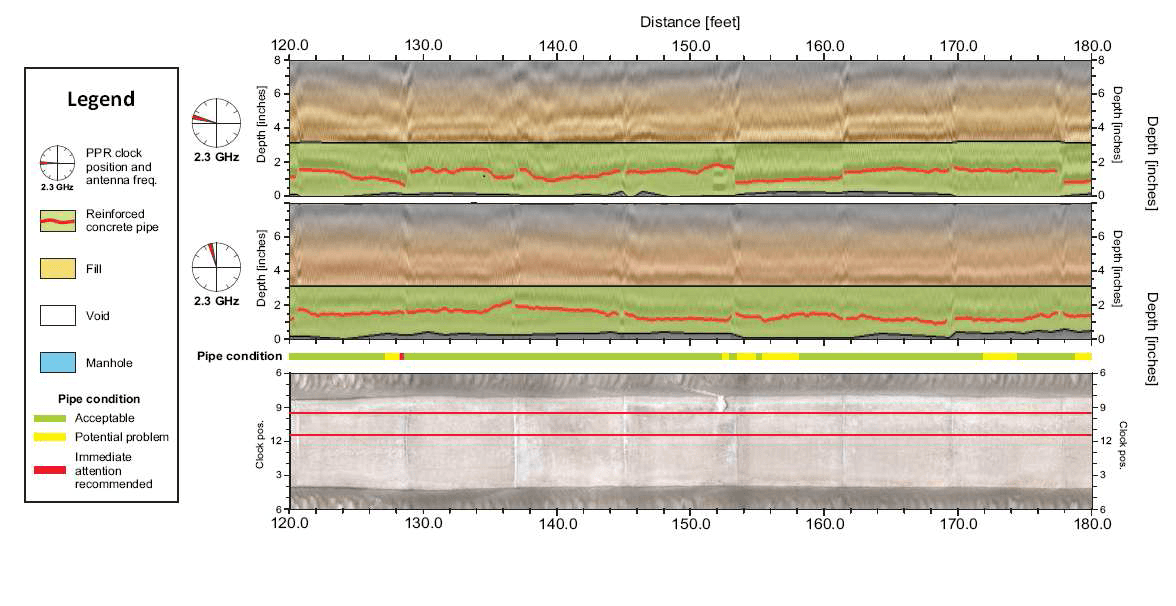
Figure 4. PPR results: the interpreted PPR profiles are correlated with the CCTV foldout view. Pipe condition is indicated by a three color marker below the PPR profies: green: acceptable, yellow: areas with potential problem, red: immediate attention is recommended.
PPR results are displayed with the interpretation superimposed on the actual depth profiles. The top two profiles typically show the individual PPR profiles with the corresponding clock position and antenna frequency denoted with an icon to the left of the corresponding profile. Horizontal scales are in feet, vertical scales are in inches.
The location of the scan lines are marked on the CCTV foldout view of the pipe at the bottom of each pipe segment with the corresponding clock positions on the vertical axis. Anomalies and other notable features are color coded. Pipe wall thickness is marked by a continuous black line, reinforcement is marked by red dots which are then connected by a red line. The CCTV data did not show significant pipe degradation.
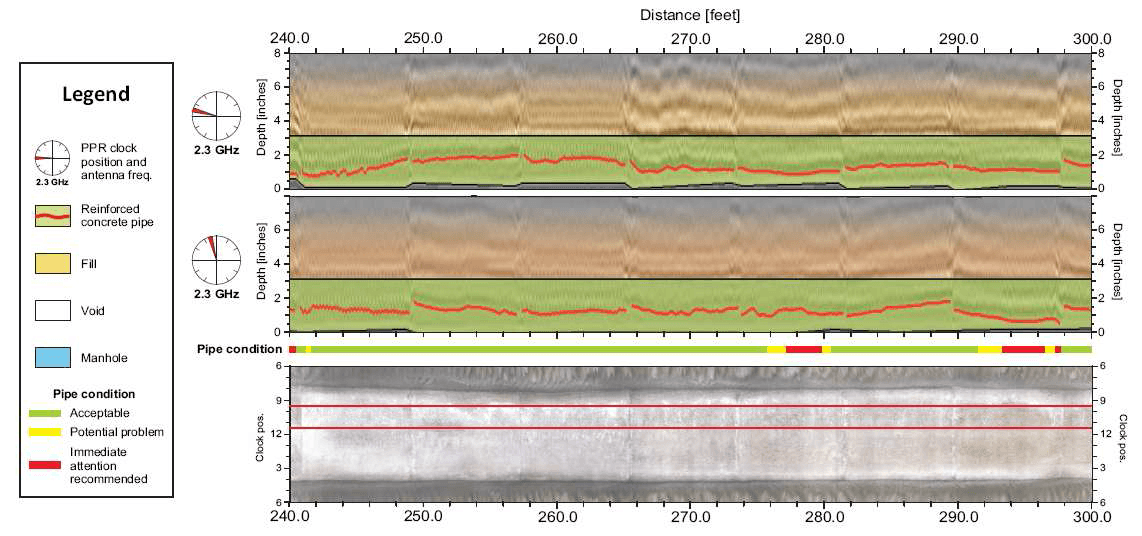
Figure 5. PPR results: the interpreted PPR profiles are correlated with the CCTV foldout view. Pipe condition is indicated by a three color marker below the PPR profiles: green: acceptable, yellow: areas with potential problem, red: immediate attention is recommended.
The PPR results clearly showed areas where the rebar cover was less than 0.53”, the recommended minimum by ASTM standards. The SewerVUE Surveyor’s LIDAR data (Figure 6) is correlated with an onboard inertial navigation system (INS) to continuously calculate the position, orientation, and velocity (direction and speed of movement) of the robot without the need for external references. Both the foldout and the cross-sections show significant erosion at the current flow level at the 7:30 and 4:30 clock positions.
LIDAR RESULTS
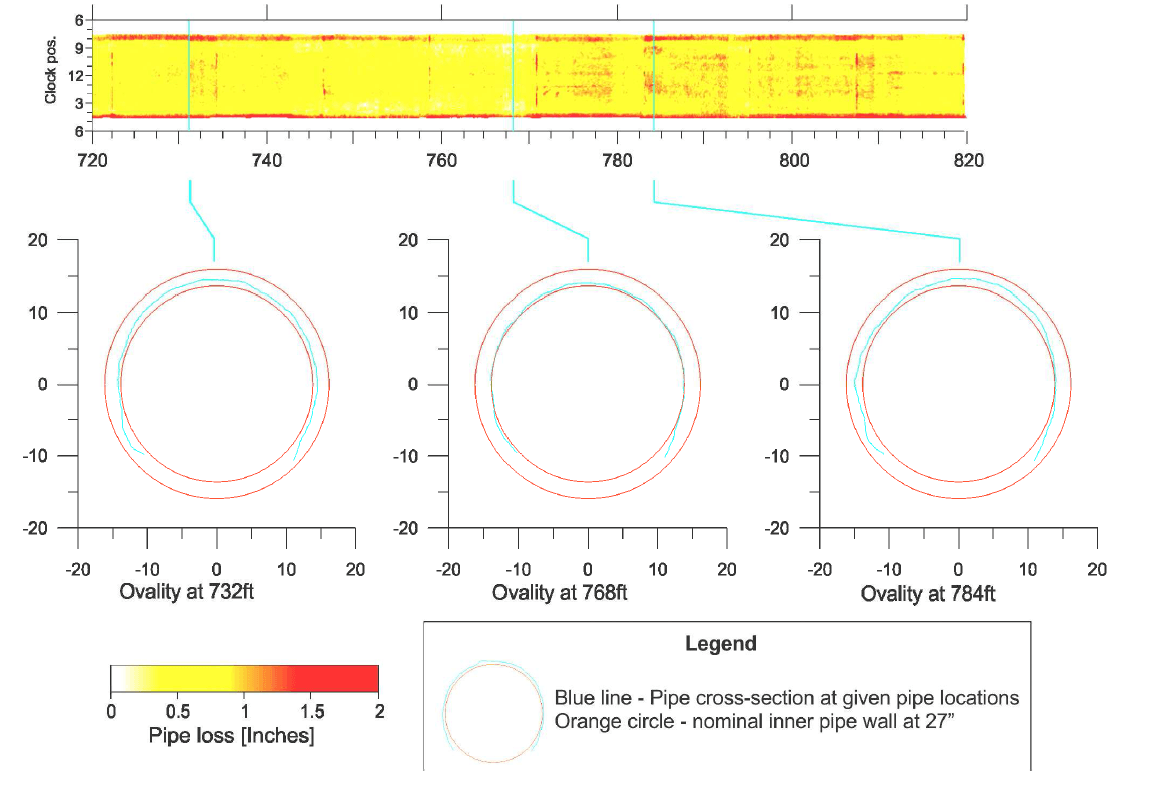
Figure 6. LIDAR results: Both the foldout and the cross-sections show significant erosion at the current flow level at the 7:30 and 4:30 clock positions.
CONCLUSIONS
PPR results showed pipe wall thickness in the 2.5-3.3” range that matched the core sample obtained by MWRD. Locations where rebar cover was less than the minimum ASTM standard were identified. No significant voids were detected along the inspected line.
PPR data show the presence of casing and grout between the casing and the sewer pipe. The grout is uniform with a 0.75 – 1” thickness. The integration of advanced pipe condition assessment technology into the MWRD pipeline condition assessment program will provide detailed supplemental inspection information in critical pipe segments where condition ratings are difficult to determine or where it is suspected that corrosion has significantly deteriorated the structural integrity, and consequently shortened the lifespan of these pipe segments.