Mid-Western USA - 2021
A Data-Driven Approach to access the Condition of Sewer Forcemain using PPR and MSI Technologies
In January 2021, SewerVUE Technology’s inspection crew travelled to the central United States to complete a pair of advanced condition assessment projects for the municipal water and wastewater department of a large city. These projects included both of SewerVUE’s Pipe Penetrating Radar (PPR) and Multi-sensor Inspection (MSI) technologies.
The subjects of the two surveys were a pair of significant wastewater lines feeding the city’s primary water reclamation facility. In both surveys, the use of advanced condition assessment methods revealed defects that were not readily apparent from a visual inspection.
Survey 1 – Pipe Penetrating Radar (PPR)
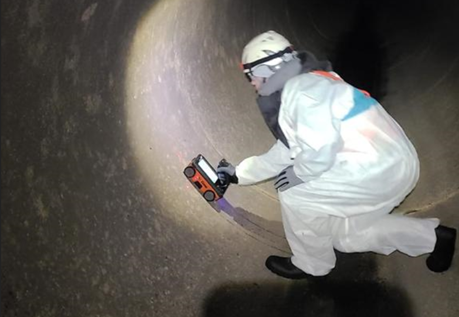
A SewerVUE technician performs PPR scanning.
The subject pipe of this inspection totalled 1,110 LF of reinforced concrete pipe (RCP). Of that length, 260 LF measured 78 inches in nominal diameter with the remaining 850 LF measuring 72 inches.
The purpose of this inspection was to ascertain the remaining thickness of the concrete pipe walls as well as the remaining rebar coverage, making PPR the technology of choice. The wide diameter of the pipe meant that a PPR technician could enter the pipe and scan it directly with a hand-held PPR scanner.
With the pipe briefly shut down, the survey was completed quickly and safely within a 12-hour window.
About Pipe Penetrating Radar
Pipe Penetrating Radar, or PPR, is an advanced condition assessment technology for non-ferrous pipes. PPR is the in-pipe application of ground penetrating radar. It uses specialized GPR antennae to scan the inner pipe wall at a higher resolution than typical GPR surveying. PPR works by emitting electromagnetic waves into the pipe wall and registering the reflected waves. When the electromagnetic waves encounter an interface between two types of material (like concrete and soil), the waves are reflected and refracted. By analyzing the recorded reflections, it is possible to map what lies beyond the inner surface of the pipe wall.
Accordingly, PPR can measure the remaining wall thickness of the pipe, detect delamination of the pipe wall, or locate any voids developing in the fill outside the pipe. Additionally, PPR can measure remaining rebar coverage in reinforced concrete pipes.PPR surveys are often conducted using a remotely-operated vehicle. However, in large pipes like the one in this project, surveys are often completed by a technician with a handheld scanner instead, provided the conditions are safe to do so.
Survey Results
Analysis of the PPR data revealed a pipe that was mostly in serviceable condition. There was no concerning variation in wall thickness throughout the run; the wall thickness measured an average 8.67 inches through the 78-inch section and an average 7.48 inches through the 72-inch section. PPR scans did not detect any notable voids developing outside the pipe walls.
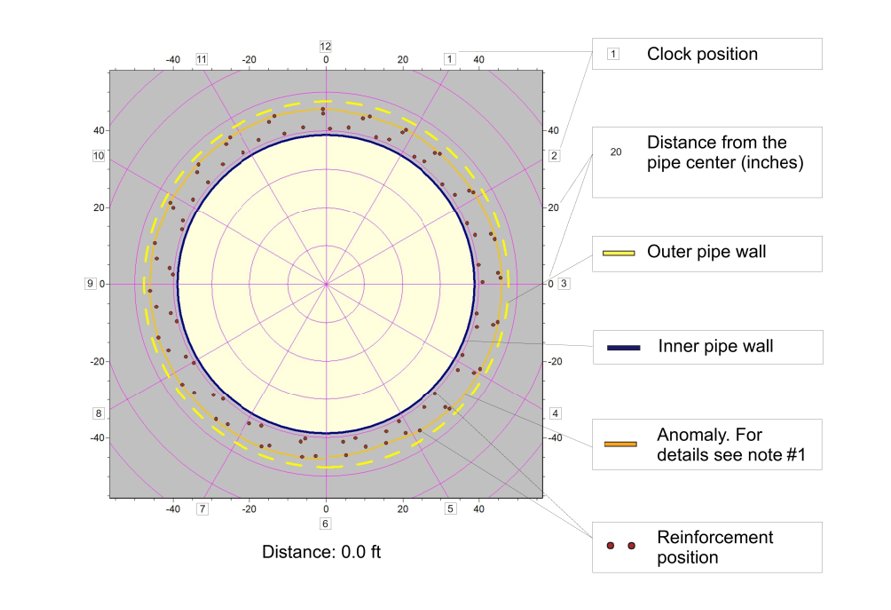
Example of PPR Cross-Section data.
In the 72-inch section, however, SewerVUE did identify two locations at which the pipe wall was delaminating. Additionally, the survey detected an anomalous signal at one location; radar detected a notable change in the pipe’s properties that were not easily explained by delamination or rebar coverage. SewerVUE recommended the pipe’s owner take a core sample at the location of the anomaly to discover the cause.Overall, the PPR survey showed a pipe in generally good condition aside from a small number of localized defects. With this information, the owner can prioritize the pipe’s maintenance budget accordingly. PPR surveying, when used as part of an ongoing condition assessment program, can provide quantitative benchmarks that allow for accurate tracking of the pipe’s deterioration over time.
Survey 2 – Multi-Sensor Inspection (MSI)
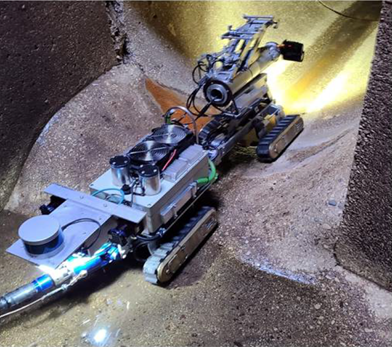
The SewerVUE surveyor entering the pipe.
The second survey was larger in scope than the first. Over the course of two days, SewerVUE and a subcontractor completed an advanced condition assessment of pipes totalling 16,860 LF:
- 10,700 LF of 48-inch RCP
- 5,800 LF of 48-inch prestressed concrete cylinder pipe (PCCP)
- 360 LF of 48-inch ductile iron pipe (DIP)
This inspection made use of SewerVUE’s remotely-operated vehicle MSI system. The primary data came in the form of high-resolution 3-D LiDAR measurements, with CCTV footage for visual correlation.
About Multi-Sensor Inspection Technology and LiDAR
SewerVUE’s MSI system is an advanced condition assessment tool which measures the physical shape of a pipe’s interior at a high resolution. The system deployed for this project used several LiDAR devices to build a detailed three-dimensional model of the inside of the pipe.
LiDAR is a remote sensing technology that emits laser pulses and measures their reflections to gauge distance to surrounding objects. With sufficient equipment and processing technology, this can create a 3-D model with enough detail to identify sagging, ovality, cracking, and many other spatial defects within the pipe. SewerVUE’s MSI system is able to keep track of its position within the pipe relative to the start point without the need for external references. This makes it effective at completing long surveys from a single access point.
Survey Results
The visual component of the survey discovered a small number of notable defects, but was otherwise unremarkable. There were several instances of excessive sediment, including some frozen sediment. More notably, there was a lengthy section of visibly sagging pipe in one of the inspected lines. The sag was identifiable over a length of 200 feet.
SewerVUE’s video reviewers did not see any indication of cracks within the pipe. The LiDAR data, however, painted a different picture: there was evidence of widespread cracking throughout four of the surveyed segments, totalling dozens of instances. Most of the cracks ranged from 4-8 feet in length and were present at many different clock positions.
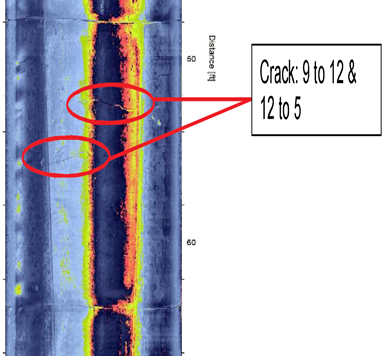
Example: snakeskin chart showing cracks.
Despite the prevalence of the cracking, it was not visible on the CCTV footage. It was only upon analysis of the LiDAR data that SewerVUE discovered it.
The report delivered following the survey detailed the locations of each observed crack. LiDAR data can be reported in several fashions, three of which were included in this project: cross sections of the pipe, a 3D point cloud, and “snakeskin” imagery. Snakeskin charts show an unwrapped 2D representation of the pipe’s internal geometry. The chart displays observed variance from the expected dimensions through color gradation.
Conclusion
Prior to SewerVUE’s surveys, the condition of the surveyed segments was not well known. Following the report, the pipes’ owner and their contractors had what they needed to accurately gauge the condition of these lines, and prioritize their maintenance budgets accordingly. Advanced condition assessment methods like PPR and MSI provide detailed, quantitative data that can form the basis of a robust condition assessment and asset management program.
To learn more about the SewerVUE technology for year-round advanced pipeline inspections, please visit our website at www.sewervue.com or contact us directly via email at sales@sewervue.com or telephone at (604) 421-0600.